Project highlights
These are the projects I've worked on where I’ve built a large part of the finished product. In the case of Parlia, I built and deployed the whole product in three different versions.
Parlia - can we burst the filter bubble?
My role: Full responsibility for implementation and deployment of backend and frontend.
Parlia was an experiment to see if it was possible to expose users to opposing perspectives in a systematic and scalable manner, and also avoid the often repetitive arguments that arise in online or mainstream media discussions.
In total I built three completely different prototypes of this product. I built both the backend and frontend for all three versions of the web app after each pivot the company went through. The startup couldn’t find product market fit and is now dormant.
The website is still active and the final version of the product can be tried out at parlia.com
Parlia Version 1 - argument mapping
The design of version 1 was based on the concept of mapping arguments and counterarguments in a tree, in order to prevent the ever repeating loop of argument/counterargument that often plays out in traditional media.
Version 1 ran on Google App Engine (GAE) with Go on the backend and ReactJS on the front end. GAE was practical in that it was possible to run the app with no maintenance on my part and without any downtime. The limitations of the GAE datastore made me decide to use CockroachDB on the next iteration to get full SQL support, in exchange for having to use cloud IaaS instead of a PaaS.
Parlia Version 2 - the encyclopedia of opinion
The design of version 2 was patterned more on Wikipedia-style articles (albeit with much more structure) than version 1 and required being able to see revisions of articles and their changes, and being able to easily revert changes in order to deal with vandalism.
The front end was a hybrid between server side rendered HTML templates and interactive features written in React, in order to make pages load faster and make sure the site would perform well in all search engines at the time.
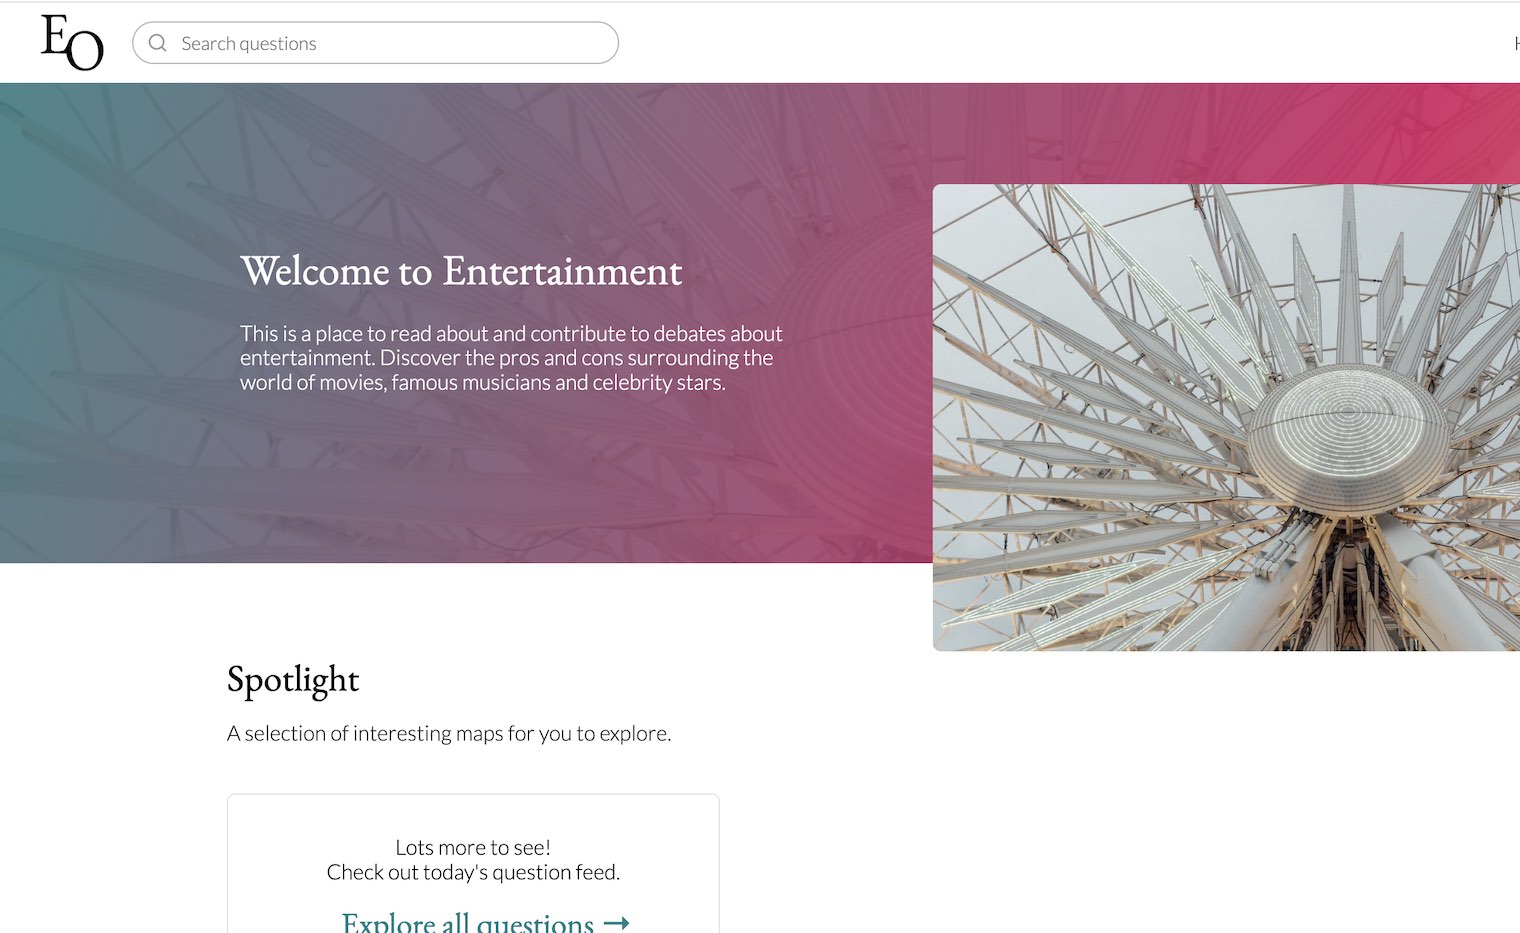
Version 2 also used Go on the backend, but was self hosted instead of using Google App Engine.
Version 2 of Parlia can be seen here. Version 2 is still visible through deep links at the time of writing.
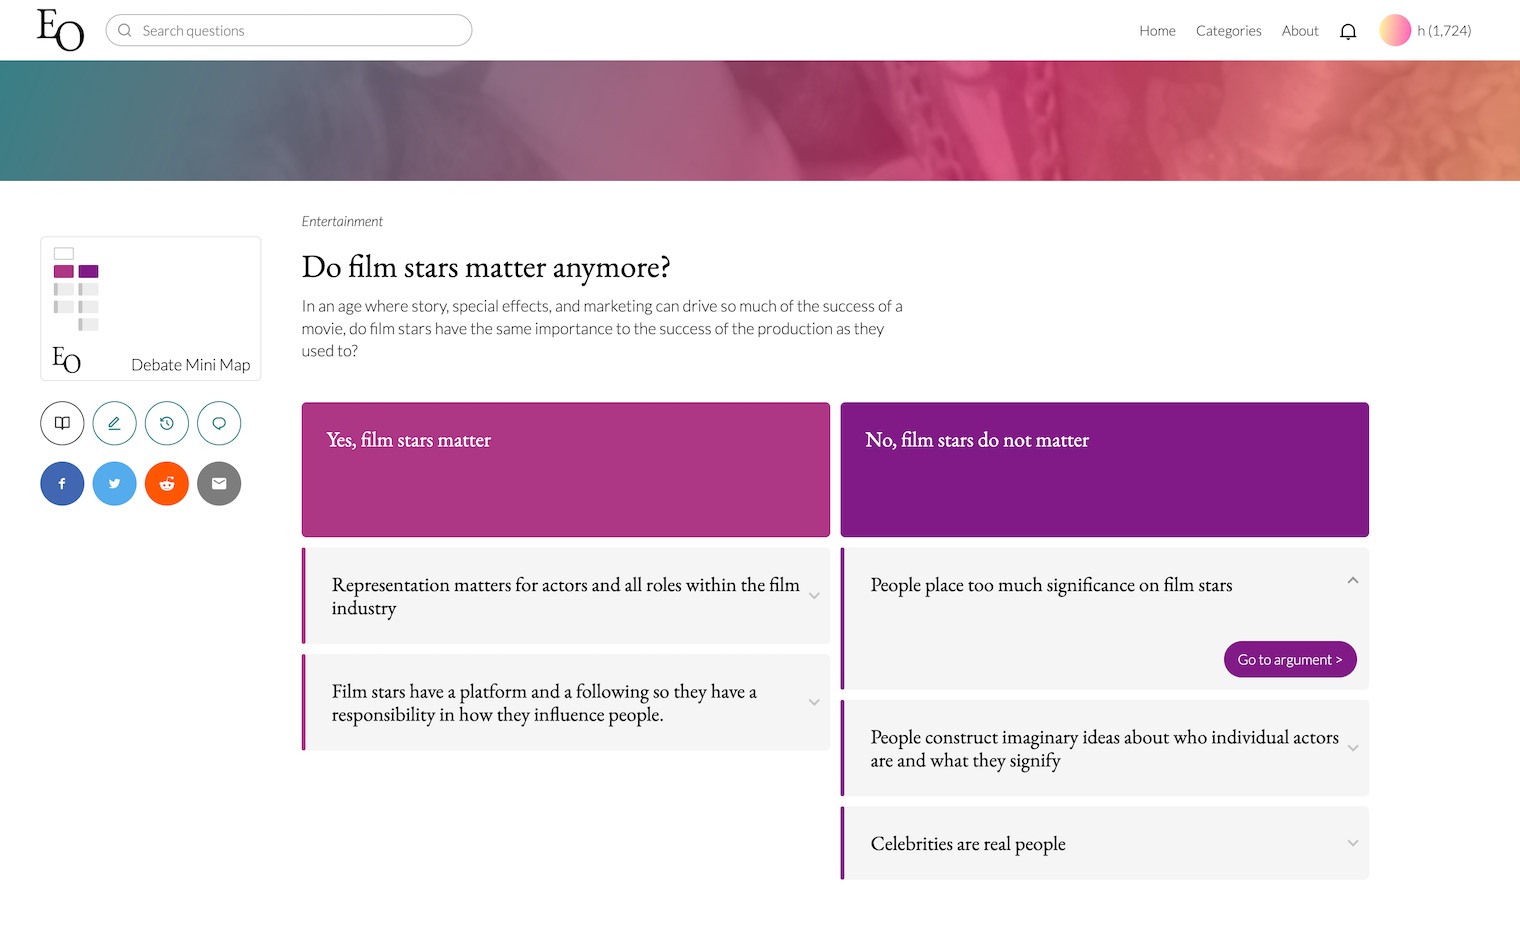
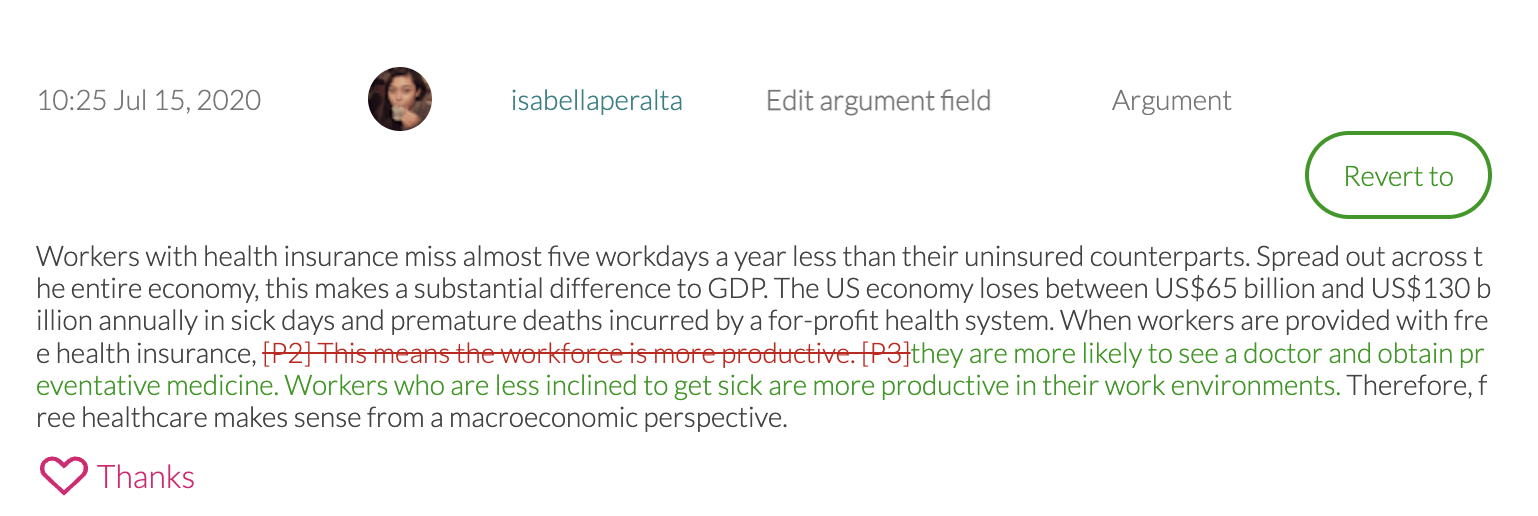
The main technical challenge was tracking revisions and allowing administrators to easily revert unwanted changes.
Parlia Version 3 - discover what your opinions say about you
Version 3 was another complete re-implementation and was designed around a feed of recommended questions that users could vote on and discuss. The goal of the redesign was to enable users to understand more about their own opinions and personality based on the answers given to these questions.
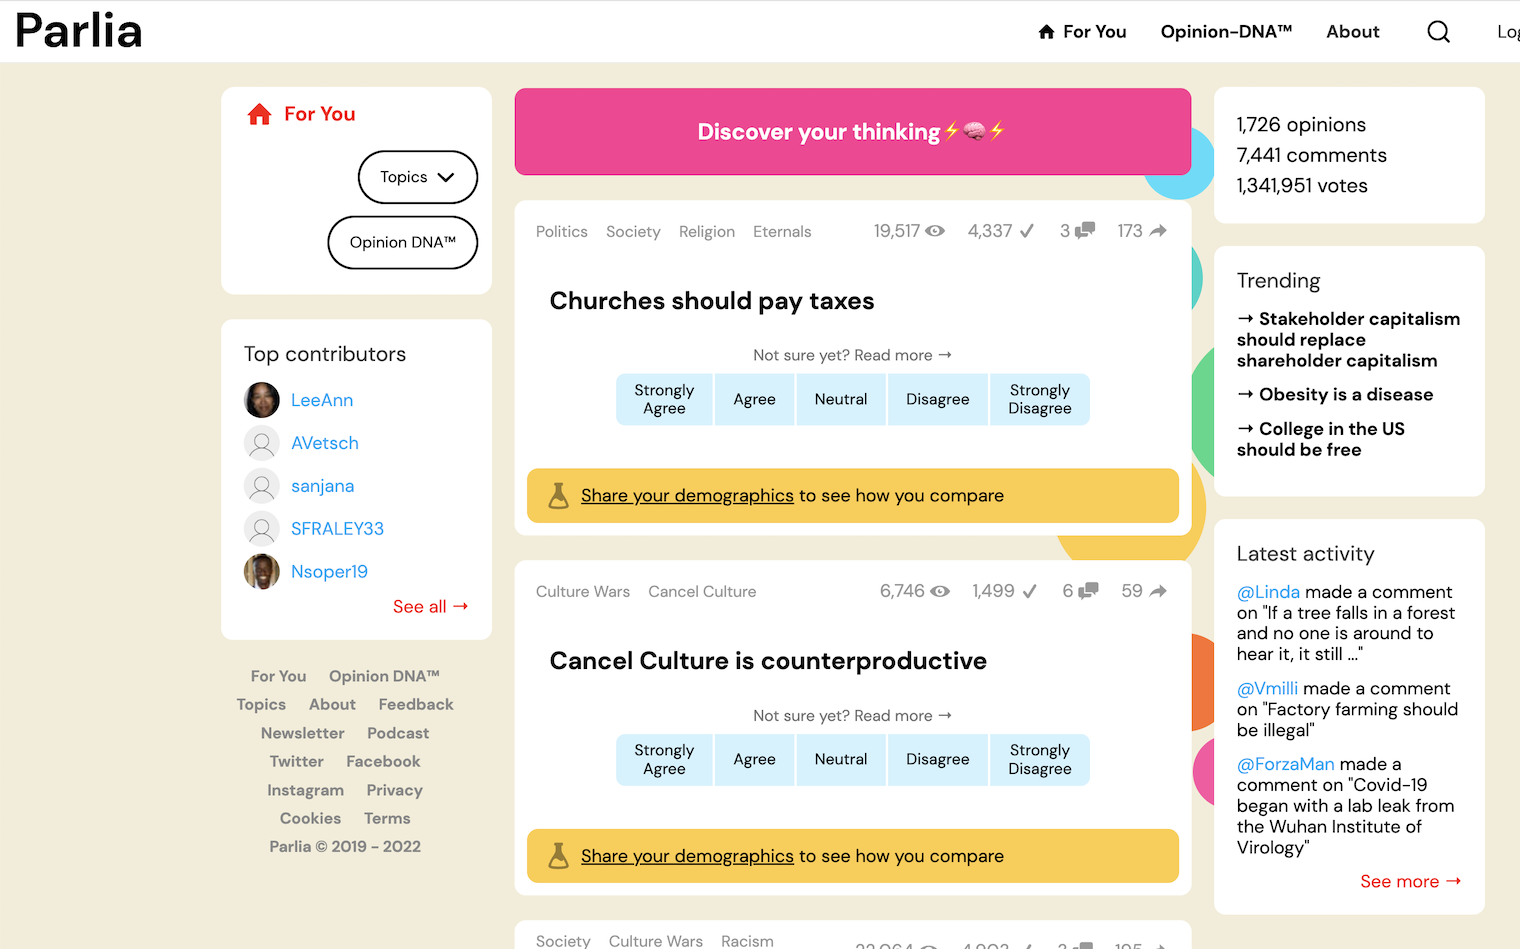
One technical challenge was making a feed UI and backend combination that performed well enough both in terms of speed and perceived precision of the various recommendation algorithms we used.
Another challenge was the implementation and design of interesting and useful insights based on user votes in relation to those of other user groups. Version 3 used the graph database Dgraph due to the very graph-centric nature of the queries required for this feature.
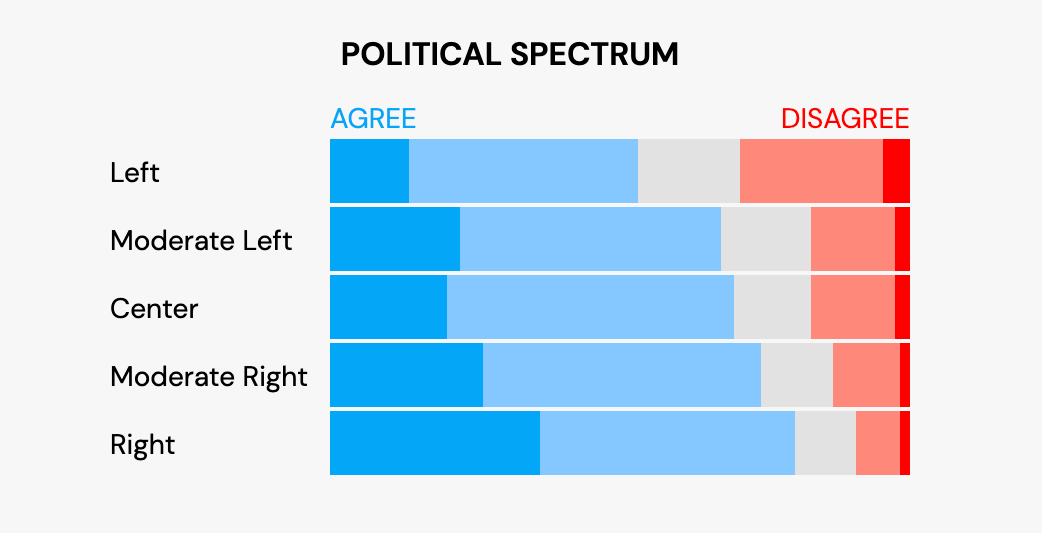
When building version 3, I used the backend stack from version 2, added Dgraph for graph queries, and started using TypeScript for the React frontend.
See version 3 of Parlia here. Version 3 was the version in use when the company went into dormancy.
Swipe - interactive presentations in the browser
My role: Technical co-founder, head of development.
Swipe started out with the observation that presentations at the time often were painful, overly complicated and lacked interactivity with the audience.
What we came up with was a browser-based presentation tool focused on the experience of giving live presentations, with interactive features like polls and analytics.
Swipe was started in Oslo in 2012, where we won a startup pitching competition. We received funding from a London VC using our early prototype and we moved the company to London in 2013. The company was later sold to Whereby before being wound down.
During the first year of development, I was in charge of all development and hiring our first developers. Later as we hired more frontend developers, I remained responsible for backend development and technical hiring.
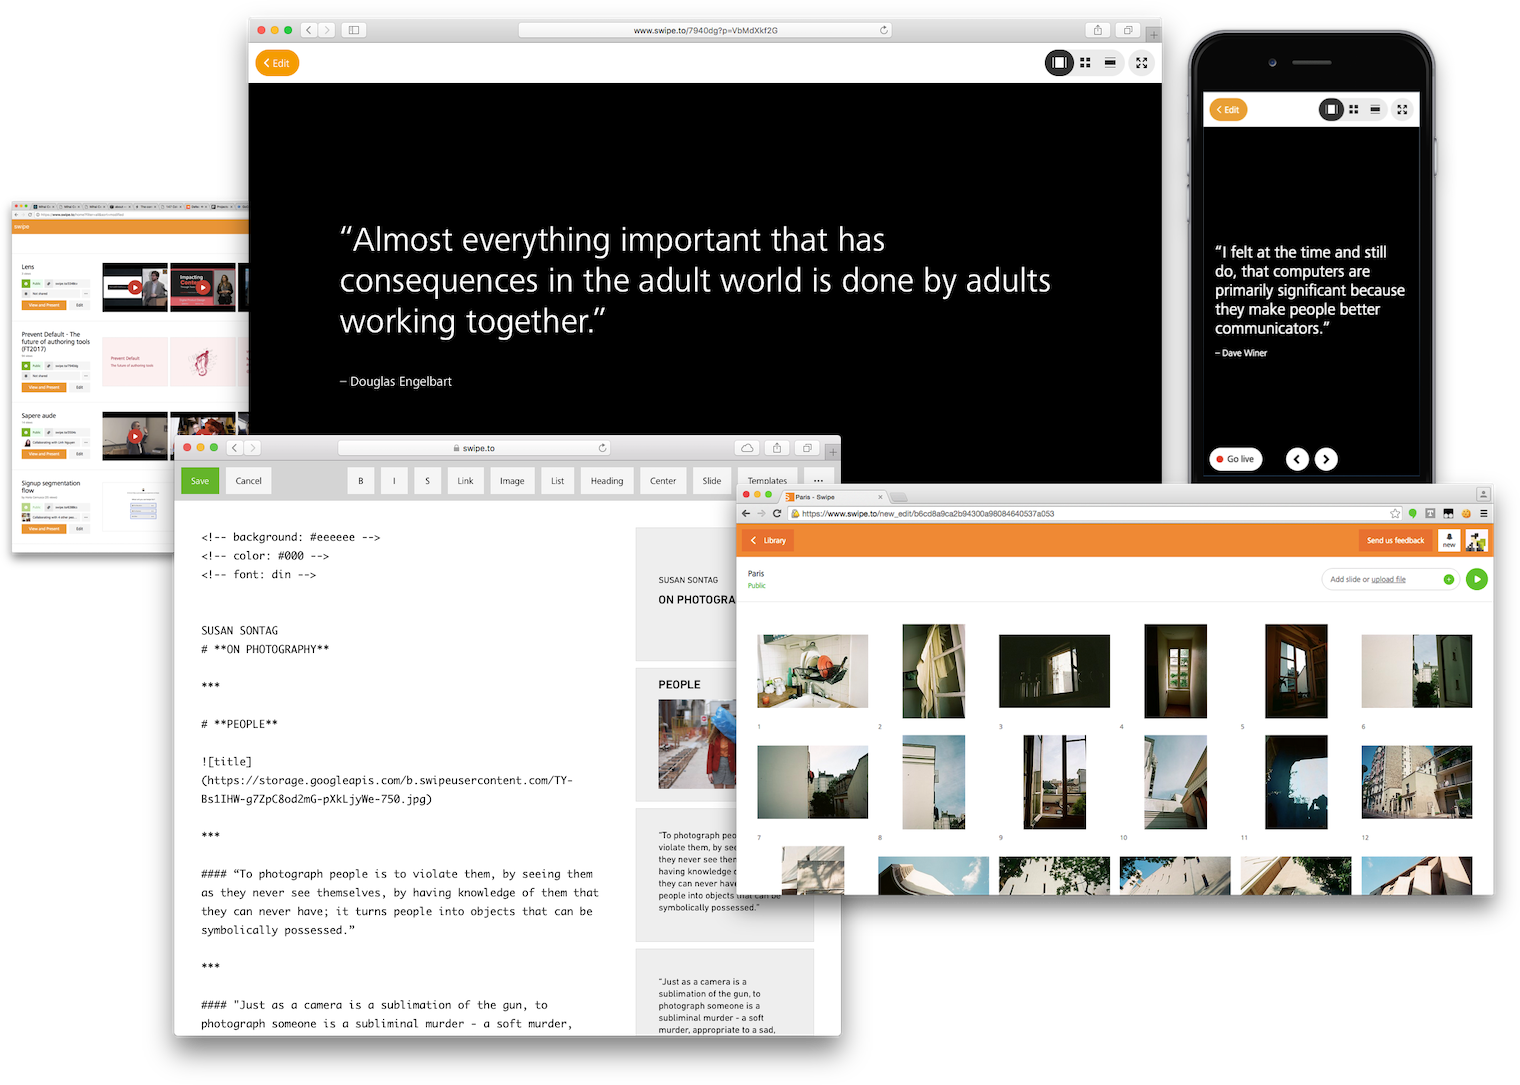
Swipe's editing features were focused on simplicity of the final product, and was based on Markdown.
Importing existing presentations saved in PDF, Keynote or PPT formats was also supported, and interactive features like polls, live visitor analytics and lead generation in the presentation itself were therefore easy to add to any existing presentation.
Since users often needed to tweak presentations at inopportune moments, we made sure the tool was equally capable on a smart phone as in a full-size browser. The presentation was controlled and viewed from the browser on a normal smart phone or laptop without the need to install any apps. This helped make it possible to conduct polls for audiences where the presenter couldn't expect the audience members to go through the process of installing an app beforehand.
To see a more detailed product walk-through, go to the main designer Mihai’s portfolio
The following are summaries describing some of the components I built as part of this role.
Main API server
The first backend version was written in Python, but was rewritten in Go when version 1.0 of Go was released (March 2012). The database I chose to use for the API server was Cassandra mainly due to its high availability capabilities.
Playback front end
The first presentation display front end which we used to secure VC funding was written by me, later replaced when we hired a dedicated front end developer.
WebSocket PubSub server
The app used WebSockets to stay in sync across devices.
The first version of the websocket server was built in Node, and a second, much more scalable version was built in Go.
Each channel on the PubSub server relayed current state to new users so late joiners or clients who had temporarily lost their connection would have the same state as other users without having to ask a separate API for this information afer a disconnect was detected. This scaled to thousands of simultaneous users per presentation with very low bandwidth requirements.
File conversion service
At the time there were few usable cloud services available for format conversion, and as far as we could find, none which fit our needs. We therefore had to build our own internal service for converting multipage documents into the images that the different browsers could read.
The service supported all popular formats of presentations including proprietary Microsoft and Apple formats and all popular image formats, outputting sizes and formats that were selectively downloaded by the playback front end depending on device screen size and zoom level.
Analytics backend and early UI
Our analytics engine was focused on fast query performance and used mainly very fast range queries of collected event data combined with in-memory processing of the results. Our analytics solution allowed the presentation creator to see which slides were of interest to which visitors and tailor their message accordingly. Aggregate analytics were also provided, mostly implemented by summarizing the event data on the backend periodically, again to allow for very fast querying of the resulting data.
For any enquiries, please contact me at [email protected]


